
01 · Real Dervoss deliverable
Deviation heatmap
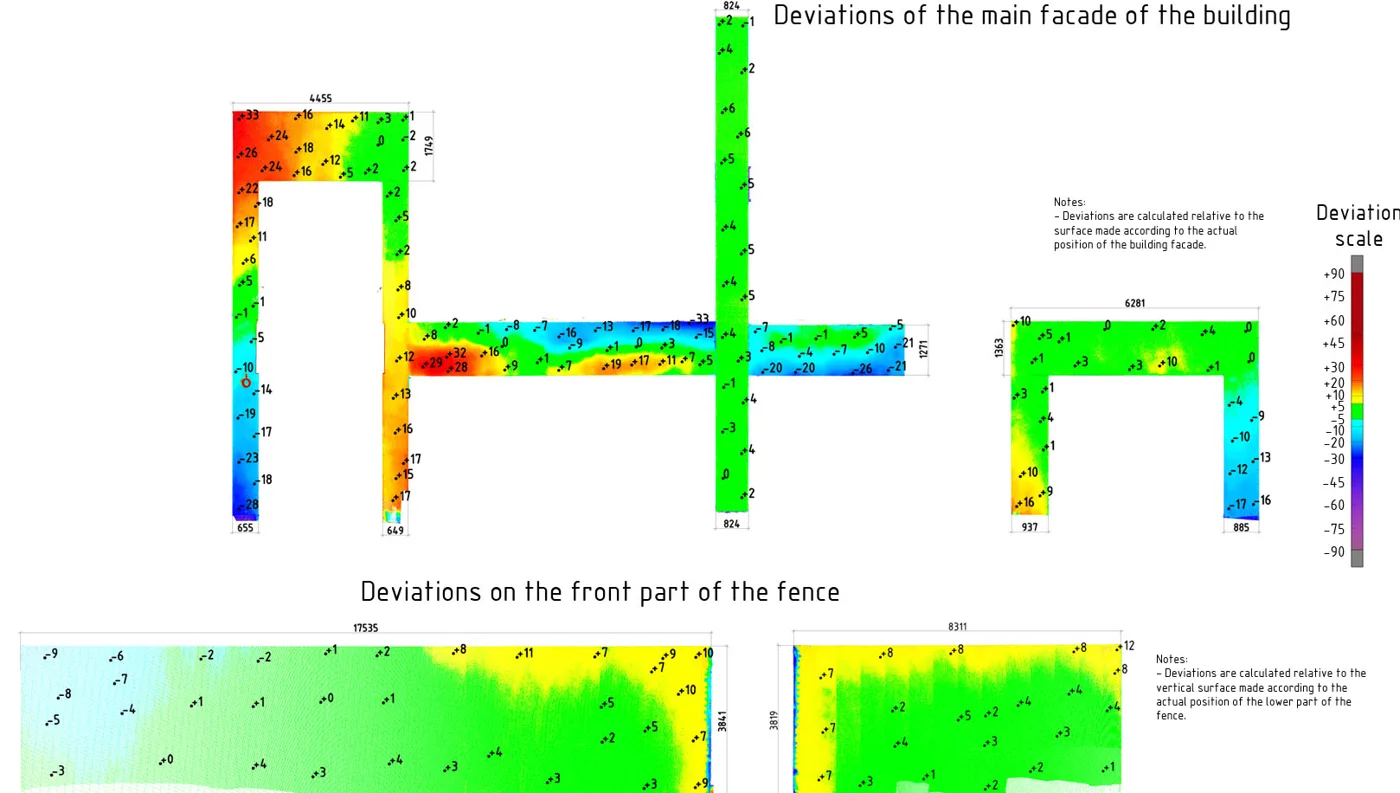
A colour map of the surface with measured values, showing where it is out of tolerance and by how much. The example above is a real Dervoss report.
3D Scanning & BIM — 01
A deviation report compares what was actually built with the design or a required tolerance. Dervoss laser-scans the surface and shows every difference as a colour map with measured values, so you see exactly where a floor, wall, column or façade is out, and by how much.
Dervoss provides deviation & flatness reports across Dubai, the UAE and Saudi Arabia, captured and produced by one in-house team.
Real Dervoss work
Real Dervoss deviation report (façade and boundary wall)
02 — What you receive
6 deliverables
01 · Real Dervoss deliverable
A colour map of the surface with measured values, showing where it is out of tolerance and by how much. The example above is a real Dervoss report.
02 · Illustration
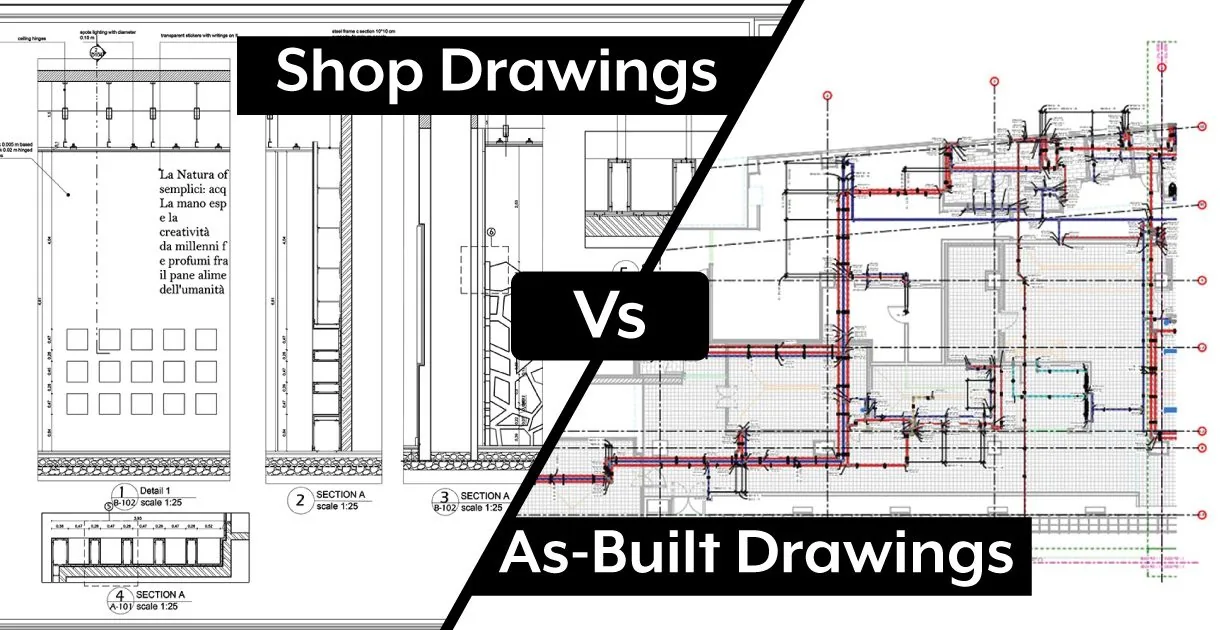
The scan compared with your DWG or Revit model, so mismatches show up before fabrication, ceiling closure or approval.
03 · Illustration
Highs, lows and level changes across floors and slabs, tied to an agreed datum, ready for grinding or levelling decisions.
04 · Illustration
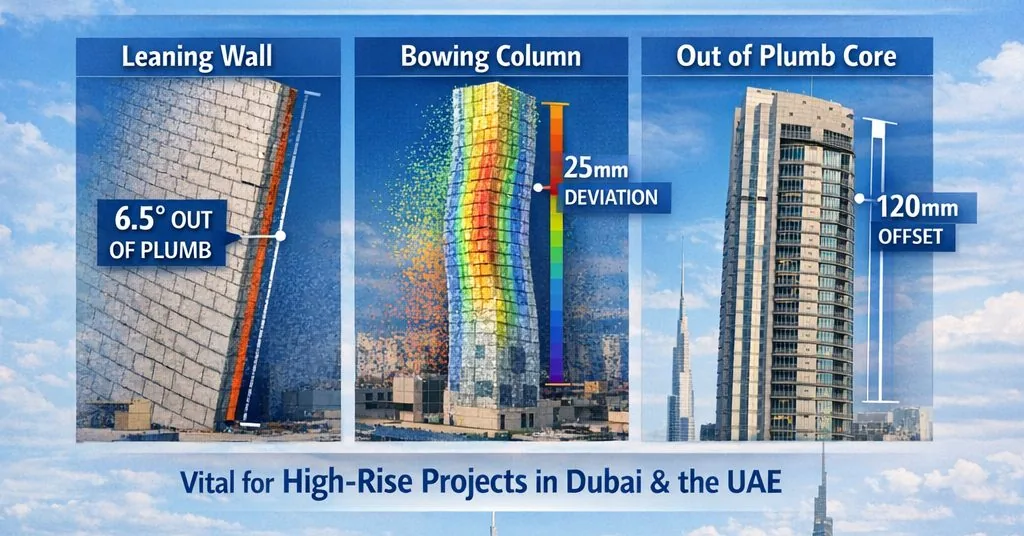
Lean and bow of walls, columns and cores, measured over their full height.

05 · Illustration
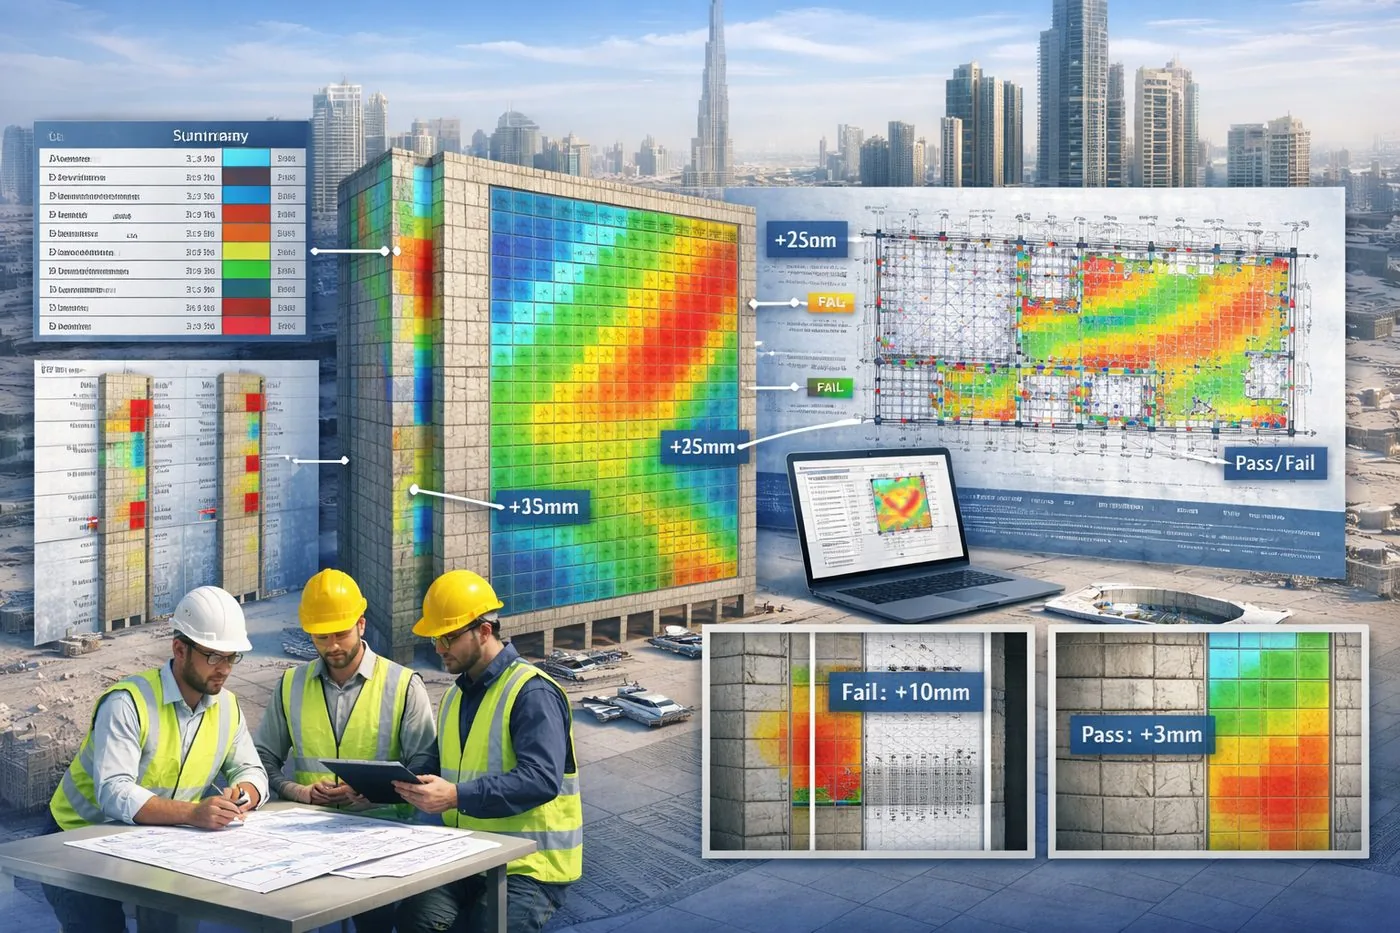
Results checked against the tolerance in your specification or method statement, with pass and fail zones marked.
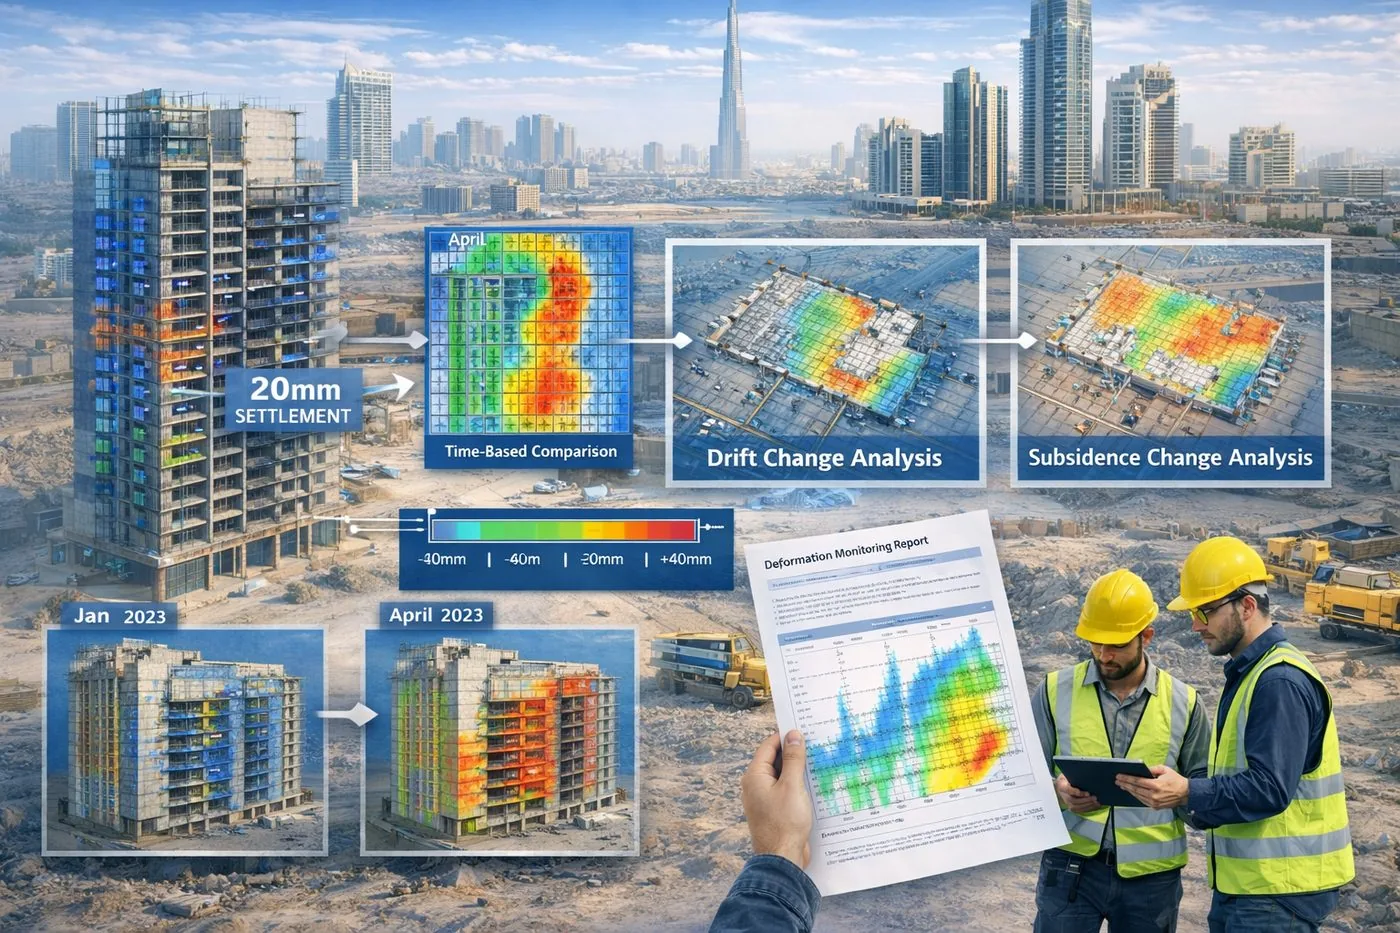
06 · Illustration
Repeat scans compared over time to show movement or settlement, with a change map for each visit.
Formats
PDF reportDWG.E57 / .RCP point cloud03 — When you need it
01
Screed, tiles, stone, parquet and resin all show a floor that isn't flat.
02
Panels made to the drawing won't fit a façade that doesn't match it.
03
QA/QC teams need measured evidence, not a few spot checks.
04
Excavation next door, demolition or new loads. Repeat scans show movement over time.
05
A measured map settles whose tolerance was missed.
Site photo · Dervoss
04 — Real project · Dubai
Walls, slabs and façade surfaces had to be checked against construction tolerances across large areas, where a few manual spot checks can't confirm misalignments, bows and surface irregularities.
The team received deviation maps of the main façade and the front boundary wall, with the measured offset marked across each surface, in a report they could act on with the contractor.
Main façade and boundary wall · measured values across every surface
Read the case study05 — How it works
Step 01
The surfaces, the reference (design model, drawing or datum) and the tolerance from your specification.
Step 02
The area is captured with the Trimble X9, a ±2 mm scanner, on the project control.
Step 03
The point cloud is compared with the reference and turned into colour maps, measured values and a pass/fail summary.
Step 04
Your team gets a report it can take into a coordination meeting or hand to a contractor. The scan stays on file for later questions.
06 — In detail
Most of the cost of a deviation comes from finding it late. A floor that’s out shows up when the tiles crack or the resin ponds. A façade that doesn’t match its drawing shows up when the first panels arrive and don’t fit. A scan before those moments turns a site argument into a measured fact and a correction plan.
That’s how a cladding panel manufacturer used it: the existing façade was scanned and modelled before fabrication, so the panels were made to the real geometry. See the façade project and the deviation analysis project.
Flatness and level maps show the highs, lows and waves across a whole floor, tied to the datum your finishes are set from. They’re most useful before screed, tiles, stone, parquet or resin go down, and before joinery or racking that needs a level base.
Verticality and alignment checks show lean, bow and out-of-plumb conditions over the full height of an element, and where a façade or wall line differs from the model. Fabricators, façade consultants and fit-out teams use them before anything is made to fit.
When excavation, demolition or new loads could move a structure, the same area is scanned at intervals and compared with the first scan. Each visit adds a change map, so movement is caught while it’s still small.
A verification survey checks selected points with a total station: right for specific positions such as a column or a slab edge. A deviation report checks the whole surface from a 3D laser scan: right when the question is about flatness, plumb or fit. If you already have a Revit model, the comparison runs against it directly; if you need one, the same scan can become a Scan to BIM model.
07 — Why Dervoss for deviation & flatness reports
A straightedge or a level checks the places someone chose to measure. A laser scan measures the whole surface, so the high spot between two checks can't hide. The same team scans and writes the report, and the point cloud stays on file for any later question.
01
No hand-off between a scanning company and an offshore drawing shop: the team that measured your site produces your deliverables.
02
Trimble X9 laser scanning and survey-grade instruments, accurate to ±2 mm, with an accuracy statement per delivery.
03
All seven emirates, Saudi Arabia and the wider GCC, with deliverables prepared for local authority requirements.
04
On site within 24 hours of a confirmed LPO; urgent concrete and utility scans often same-day.
08 — Questions
A deviation report shows the difference between what was built and what was designed, or the tolerance it had to meet. From a laser scan, every point of the surface is compared with the reference and shown as a colour map with measured values.
Yours. The tolerance comes from your project specification, the consultant's requirements or the method statement, and the report is checked against exactly that.
It depends on what your specification asks for. If the spec names a particular test method, the scan complements it and shows the whole floor in between. If it asks for flatness or level within a tolerance, the scan measures every point of the surface against it. Send us the clause and we'll tell you which applies.
Yes. The scan is aligned with your model or drawing on the project coordinates, and every difference between the two is measured.
Yes. The same area is scanned at intervals from fixed control and each scan is compared with the first, so movement or settlement shows up as a change map.
It's what quality teams call the measured check that construction meets the design and its tolerances before it's accepted. A scan-based deviation report gives them full-surface evidence instead of a handful of manual readings.
It depends on the area, the number of surfaces and whether it's a one-off check or repeat monitoring. Send the drawings and the spec clause and you get a fixed quote.
09 — Get a fixed quote
Describe the job in your own words; you don't need to know the right survey name. A fixed price and a committed delivery date, no obligation. Plans or photos? Send them on WhatsApp.
On site
Within 24 h of a confirmed LPO
Office
Al Barsha South 3, Dubai
Hours
Mon-Fri 10:00-18:00